What is GLOBIO?
The GLOBIO model
GLOBIO calculates local terrestrial biodiversity intactness, expressed by the mean species abundance (MSA) indicator, as a function of six human pressures: land use, road disturbance, fragmentation, hunting, atmospheric nitrogen deposition and climate change. The core of the model consists of quantitative pressure-impact relationships that have been established based on extensive terrestrial biodiversity databases.
GLOBIO combines the pressure–impact relationships with data on past, present or future pressure levels, typically retrieved from the IMAGE model. This results in maps with MSA values corresponding with each pressure. These maps are then combined to obtain overall MSA values, as illustrated in the figure. Next, MSA values are aggregated to larger (user-defined) regions. In addition, the contributions of the different pressures to the losses in MSA are quantified for each region.
GLOBIO also includes a routine to downscale coarse-grained land-use data to more fine-grained maps (currently with a resolution of 10 arc-seconds; ~300 m at the equator). This routine was developed because current global land‐use models have a relatively low spatial resolution hence tend to underestimate the spatial heterogeneity of land-use patterns. The downscaling routine requires regional totals or demands (‘claims’) of each land-use type and allocates these to the grid cells within the region in order of decreasing suitability for that land-use type.

The GLOBIO-Aquatic model
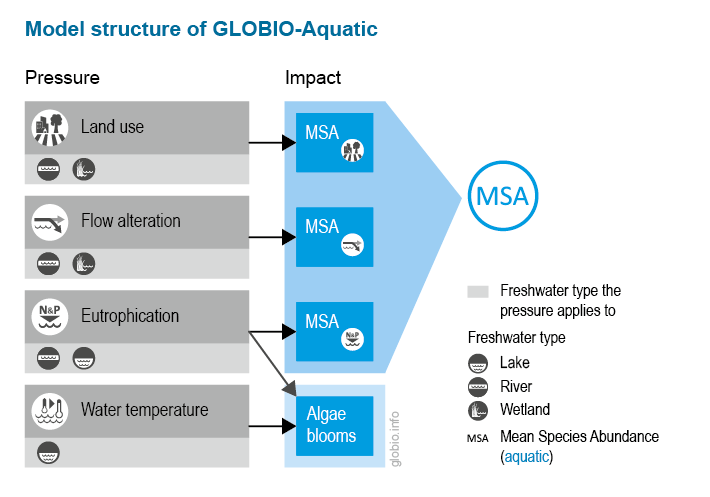
GLOBIO-Aquatic quantifies freshwater biodiversity intactness, expressed by the mean species abundance (MSA) indicator, as a function of various key human pressures on freshwater systems. In addition, the model calculates the occurrence of harmful algal blooms in lakes, as an indicator of water quality. Currently GLOBIO-Aquatic includes the following pressures: land use in the upstream catchment, streamflow alteration (due to dams and climate change), eutrophication from agricultural and urban sources and water temperature (as influenced by climate change). Pressure-impact relationships are quantified based on extensive literature review.
GLOBIO-Aquatic covers different freshwater systems: flowing water (rivers, streams), lakes and wetlands. Losses in MSA are calculated per freshwater system type, using specific pressure-impact relationships and pressure input data retrieved from various sources, including the IMAGE model, the Global Nutrient Model, global hydrological models (PCR-GLOBWB or LPJmL) and datasets on current and planned dams. GLOBIO-Aquatic follows a catchment approach: impacts on a certain water body depend on the land-use and/or the accumulated nutrients aggregated over the upstream part of the corresponding catchment. After calculating the MSA per freshwater type per grid cell, the MSA values can be aggregated across different freshwater types and/or to larger (user-defined) regions. Similar to the GLOBIO model for terrestrial biodiversity intactness, the contribution of each pressure to the MSA loss in a region can also be calculated.
The GLOBIO-Species model
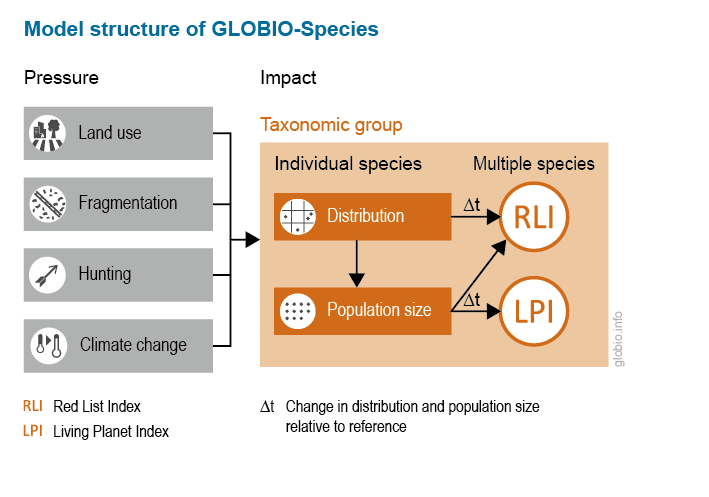
GLOBIO-Species is the most recent extension of the GLOBIO model family. It is designed to assess the impacts of human pressures on the distribution and population size of individual vertebrate species (for example, mammals and freshwater fishes). This allows for calculating multi-species indicators based on species distribution and abundance, notably the Red List Index (RLI) and the Living Planet Index (LPI). The RLI measures changes in extinction risk and the LPI measures relative changes in population abundance, in both cases aggregated across multiple species. Both indicators are commonly used to track progress to achieving (global) biodiversity targets.
Pressures currently included for terrestrial vertebrates are land use, habitat fragmentation and hunting. For freshwater fish species, GLOBIO-Species accounts for the impacts of climate change (via altered streamflow and water temperature) and habitat fragmentation by dams and barriers.
Once the species’ distribution has been delineated, the population size of the species is estimated using a population density model. Next, changes in distribution and abundance between different time steps are used to estimate RLI or LPI.
The GLOBIO-ES model
GLOBIO–ES calculates the current state, trends and possible future scenarios of ecosystem services (ES) globally. Ecosystem services are the benefits that people obtain from nature. Examples include the provisioning of food and drinking water, the regulation of climate and soil quality, and the support to mental and physical health through the experience of nature.
Based on literature review, quantitative relationships between ecosystem services and various driving variables have been developed and are continuously updated. The methodology closely links to outcomes from the IMAGE model and uses information on several spatially explicit socio-economic (e.g. population dynamics, economic development, governance) and environmental (e.g. climate change, land use change) variables from this model. Land use and land management are key pressures influencing ecosystem services provisioning directly. Other important variables are various ecosystem properties as well as societal aspects that influence the demand for ecosystem services.

GLOBIO-ES assesses a variety of ecosystem services, including provisioning services (food crop production, grass production for livestock, wild food provision), regulating services (carbon sequestration and storage, soil erosion protection, pollination, pest control) and cultural services (recreation). Recently we set out to also develop modules for assessing ecosystem service provisioning specifically by urban green and blue infrastructures (so-called urban nature-based solutions).
The Mean Species Abundance (MSA) metric
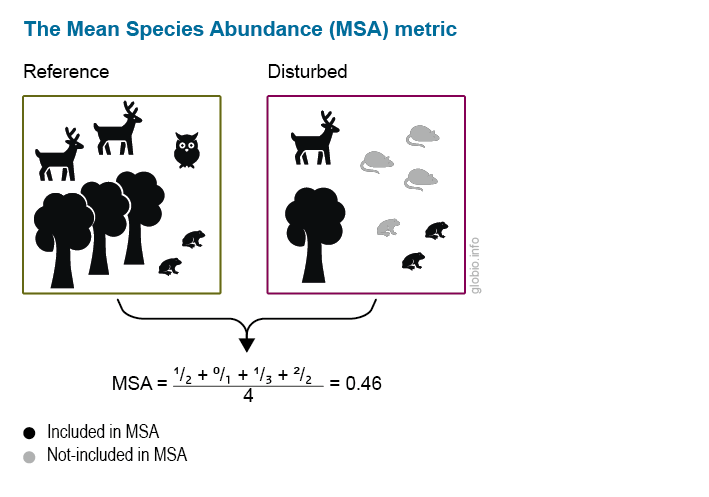
The Mean Species Abundance (MSA) metric is an indicator of local biodiversity intactness. MSA ranges from 0 to 1, where 1 means that the species assemblage is fully intact, and 0 means that all original species are extirpated (locally extinct). MSA is calculated based on the abundance of individual species under influence of a given pressure, compared to their abundance in an undisturbed situation (natural situation/reference). Only species present in the undisturbed situation are included, and increases in individual species abundance from the reference to the impacted situation are ignored. This is done to avoid the indicator being inflated by opportunistic or generalist species that benefit from habitat disturbance.
For example, in the picture below, three species decrease in abundance (tree, deer and owl) and two show an increase (frog, rodent). As new species and abundance increases do not count, the MSA is calculated as the mean of the abundance ratios of the four species in the reference situation, whereby the increase in frog abundance is ignored.


